
Akatekyi Crocodile Pond: A Place...
September 29, 2025
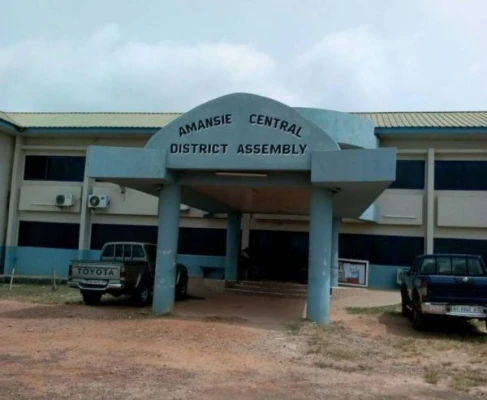
Geographical Location and Borders
Amansie Central District is situated in the southern expanse of the Ashanti Region, positioned between Latitude 6000N and 6030N, and Longitudes 1000W and 2000W. The district shares its borders with various neighboring regions: the Amansie East District to the north-east, the Amansie West District to the west, the Obuasi Municipal to the south-east, the Adansi North District to the east, the Adansi South District to the south, and the Upper Denkyira District in the Central Region to the south.
Population: Structure and Composition
As of the 2010 Population and Housing Census, the Amansie Central District hosts a population of 90,741, contributing to 1.9 percent of the entire region's populace. The gender distribution is nearly balanced, with males accounting for 49.9 percent and females representing 50.1 percent. Approximately 89 percent of the population resides in rural areas. The district's sex ratio stands at 99.5. The population's age distribution reveals a youthful profile (42.9%), culminating in a broad-based population pyramid that tapers toward a smaller contingent of elderly individuals (5.7%). The District's overall age dependency ratio is 94.9, where males exhibit a higher age dependency ratio (97.4) than females (92.4).
Fertility, Mortality, and Migration
The Total Fertility Rate within the district is 4.7. The General Fertility Rate is noted at 138.7 births per 1000 women aged 15-49 years. The Crude Birth Rate (CBR) stands at 30.4 per 1000 population, while the Crude Death Rate is 5.6 per 1000. Mortality within the district is characterized by diverse causes; incidents such as accidents, violence, homicide, and suicide contribute to 10.3 percent of all deaths, with other causes accounting for the remaining 89.2 percent. Migration patterns reveal that slightly over 50 percent of the district's migrants were born in the Ashanti Region, with a little under 50 percent originating from other regions. Among migrants born in different regions, the majority hail from the Upper East Region (16.8 percent), followed by the Central Region (16.4 percent).
Household Characteristics
The district sustains a household population of 89,350, distributed across 21,511 households. The average household size stands at 4.2 individuals. Children constitute the largest segment of household members, comprising 43.9 percent, while spouses account for approximately 11.3 percent. Nuclear households, comprising a head, spouse(s), and children, constitute 34.2 percent of the total households within the district.
Marital Diversity
Marital status within the district demonstrates a diverse landscape. Around 41.3 percent of the population aged 12 years and older are married, 34.6 percent have never married, 11.7 percent are in consensual unions, 4.2 percent are widowed, 4.9 percent are divorced, and 2.2 percent are separated. Noteworthy disparities emerge by age and gender; for instance, at ages 25-29, 53.8 percent of females are married compared to 34.1 percent of males. The widowed population is prominent among females aged 65 and above (48.3 percent), while for males, this figure stands at 8.7 percent. Educational attainment plays a role in marital status and employment, with 33.7 percent of married individuals lacking education and 8.5 percent of the unmarried having never attended school. Employment rates are high among the married (88.0 percent) and lower among the unmarried (67.9 percent).
Nationality and Literacy
The district boasts a predominantly Ghanaian population by birth, constituting 96.5 percent of residents. Naturalized citizens account for 0.5 percent, and non-Ghanaians comprise 1.6 percent of the district's inhabitants. In terms of literacy, 73.9 percent of individuals aged 11 years and above are literate, with males exhibiting higher literacy rates (92.4 percent) than females (81.7 percent). About 69.9 percent of the population aged 3 years and above are proficient in both English and Ghanaian languages. Moreover, 21.9 percent have never attended school, 41.7 percent are currently attending school, and 36.4 percent have previously attended school.
Economic Dynamics
Economic activity within the district showcases a workforce where 76.6 percent of individuals aged 15 years and older are economically active, while 23.4 percent are not engaged in economic activities. Of the economically active, 95.9 percent are employed, and 4.1 percent are unemployed. The economically inactive group includes students (50.5 percent), individuals performing household duties (24.0 percent), and those who are disabled or too sick to work (6.7 percent). The majority of the unemployed (70 percent) are seeking work for the first time.
Occupational Landscape and Employment
Among the employed population, the majority (73.1 percent) are engaged in skilled agricultural, forestry, and fishery work. Approximately 8.5 percent are involved in service and sales, 6.3 percent in craft and related trades, and 4.5 percent are in managerial, professional, and technical roles. When evaluating employment status and sector, 77.6 percent of the population aged 15 years and older are self-employed without employees, 8.7 percent are contributing family workers, 2.5 percent are casual workers, and 0.5 percent are domestic employees. The private informal sector dominates as the district's primary employer, engaging 94.3 percent of the population, followed by the public sector at 3.9 percent.
September 29, 2025

September 29, 2025

September 26, 2025

September 18, 2025
September 18, 2025

September 4, 2025
September 3, 2025

August 28, 2025

August 19, 2025

August 8, 2025